Frequency analysis of the analog output signal from the torque sensor .
Because the output signal from the torque sensor goes to the amplifier and is filtered there between DC and 400 Hz , we thought part of the signal would be lost . Therefore , we decided to display the signal on a frequency analyzer .
This gave following result :
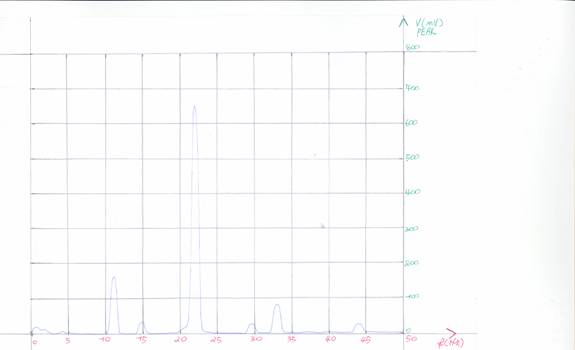
Frequency analysis of the analog voltage torque signal from DC till 50 Hz
This is the analysis at the maximum RPM at which tests are executed , namely 1400 RPM or 1400/60 Hz = 23,3 Hz . This way the highest frequency components that can occur , are visualized . Full scale of this plot is 50 Hz in the X-direction and 800 mV in the Y-direction .
In this plot we recognize following important components :
· The most important one at the RPM itself and its multiples .
· The second biggest one at half the RPM and its multiples , representing the ignition .
· Then a third one at 1/3th of the RPM and its multiples , possibly representing a dephasement of 120º of the balancing .
We noticed that there are hardly components which exceed 50 Hz . This is due to the heavy flywheel , which acts as a mechanical filter and clears out components of high frequency . This way , the electronic filter that filters between 0 Hz and 400 Hz has very little influence and might be put there to suppress the noise on the signal .
This is a second plot obtained with the frequency analyzer :
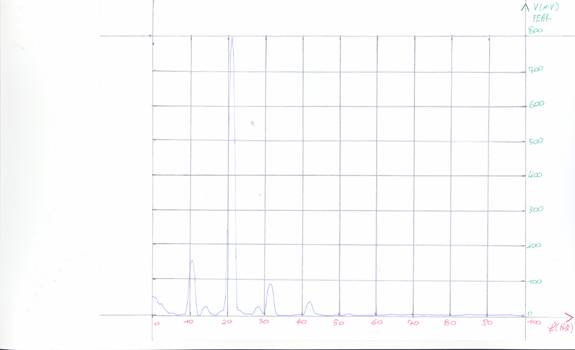
Frequency analysis of the analog voltage torque signal from DC till 100 Hz
This plot is at the maximum RPM as well , but this time the full scale in the X-direction is 100 Hz and the full scale in the Y-direction remains 800 mV . This plot was only made to prove that there are no relevant components above 50 Hz .
From this analysis , we conclude that sampling the output voltage from the amplifier at a frequency of 500 Hz is more then satisfying .
There is one little remark left that has to be made . The plots were made with a XY-plotter from the labo , which is able to make plot screens directly from the screen of the frequency analyzer . When we tried to make plots in the beginning , we noticed that the needle of the plotter exceeded the dimensions of an A4 format paper . We solved this problem by measuring the voltage that characterizes the size of the target paper and added a voltage divider to make the track of the needle fit into an A4 paper .